Web Interface
Abstracts Explorer includes a browser-based interface for searching, chatting, rating, and visualizing conference abstracts.
A live demo is available at abstracts.hzdr.de.
The interface has four tabs. A header bar at the top lets you switch conference and year; the selected filters apply to every tab. Click the Help button in the header to open this documentation page.
Prerequisites: You need to have downloaded papers first (
abstracts-explorer download) and, for semantic search and AI Chat, created embeddings (abstracts-explorer create-embeddings).
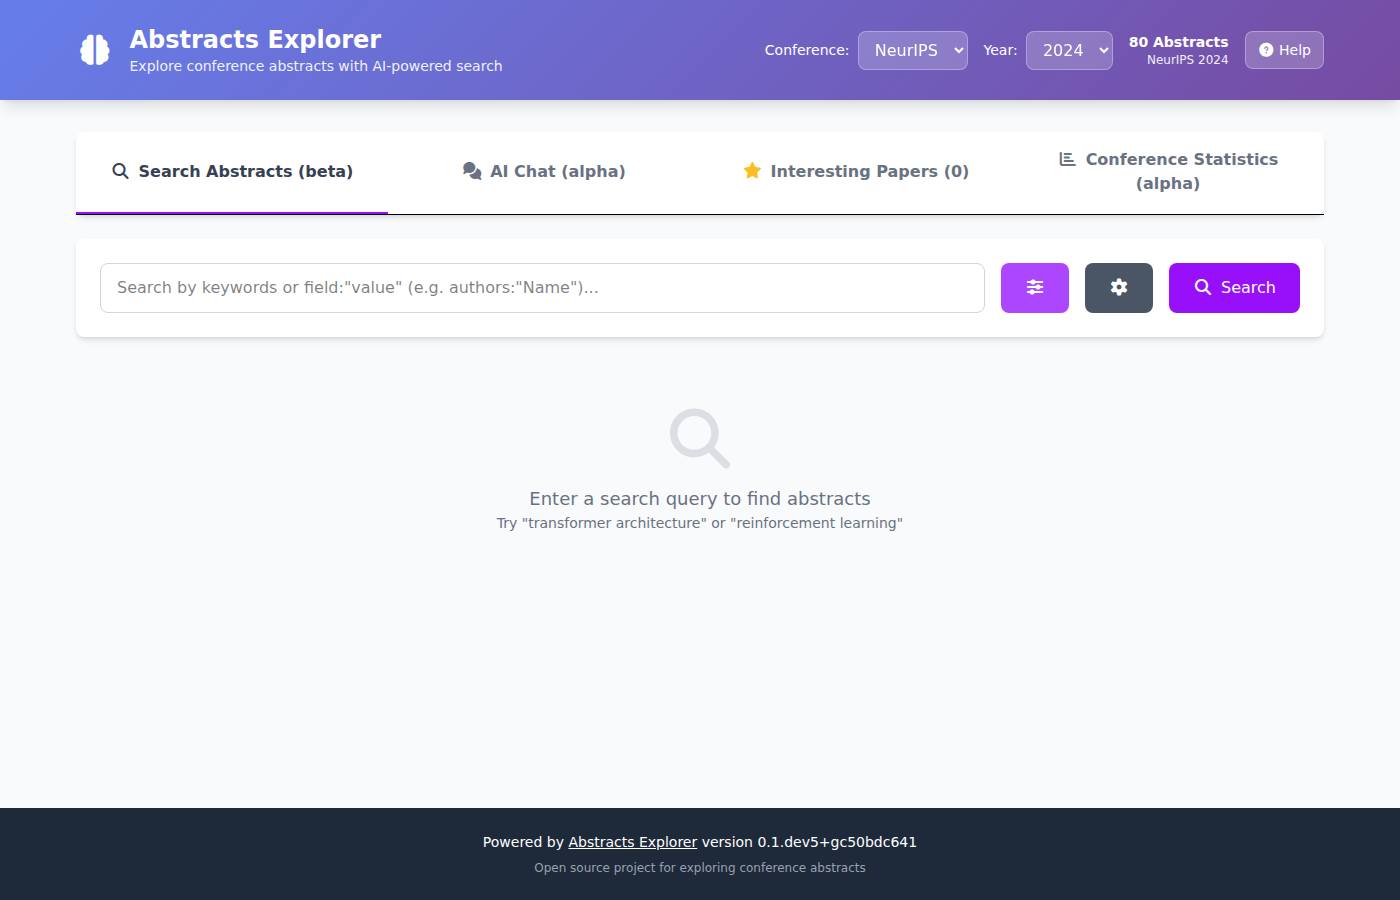
Search Abstracts
The default tab. Type a query and press Search to find matching papers.
How to search:
Keyword or semantic search — type any topic or phrase (e.g.
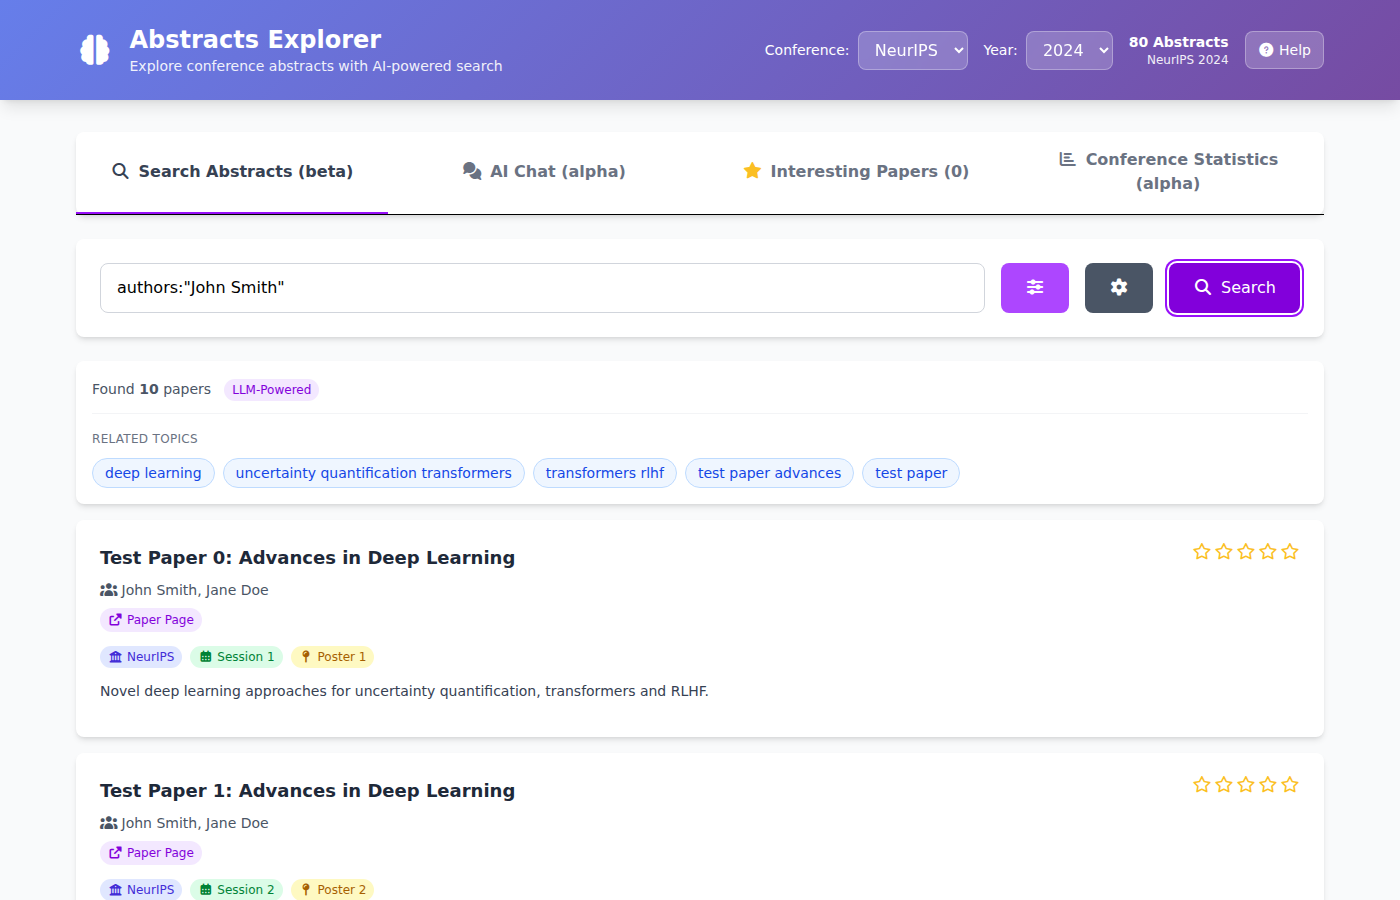
"uncertainty quantification") and press Search. Results are ranked by AI-powered similarity when embeddings are available.Field search — narrow results to a specific field using
field:"value"syntax, e.g.authors:"Jane Smith"ortitle:"transformer". Field searches work without an embedding model.Advanced Search — click the sliders button (⚙ icon with sliders) next to the search bar to open a form where you can fill in topic, authors, title, keywords, abstract, and award fields separately.
Settings — click the gear button to choose how many results to show (10 / 25 / 50 / 100) and to filter by session or track.
Conference / Year filter — use the header dropdowns to restrict results to a specific conference and year.
Rating papers: Click the stars on any paper card to rate it (1–5 stars). Rated papers are automatically saved to the Interesting Papers tab.
AI Chat
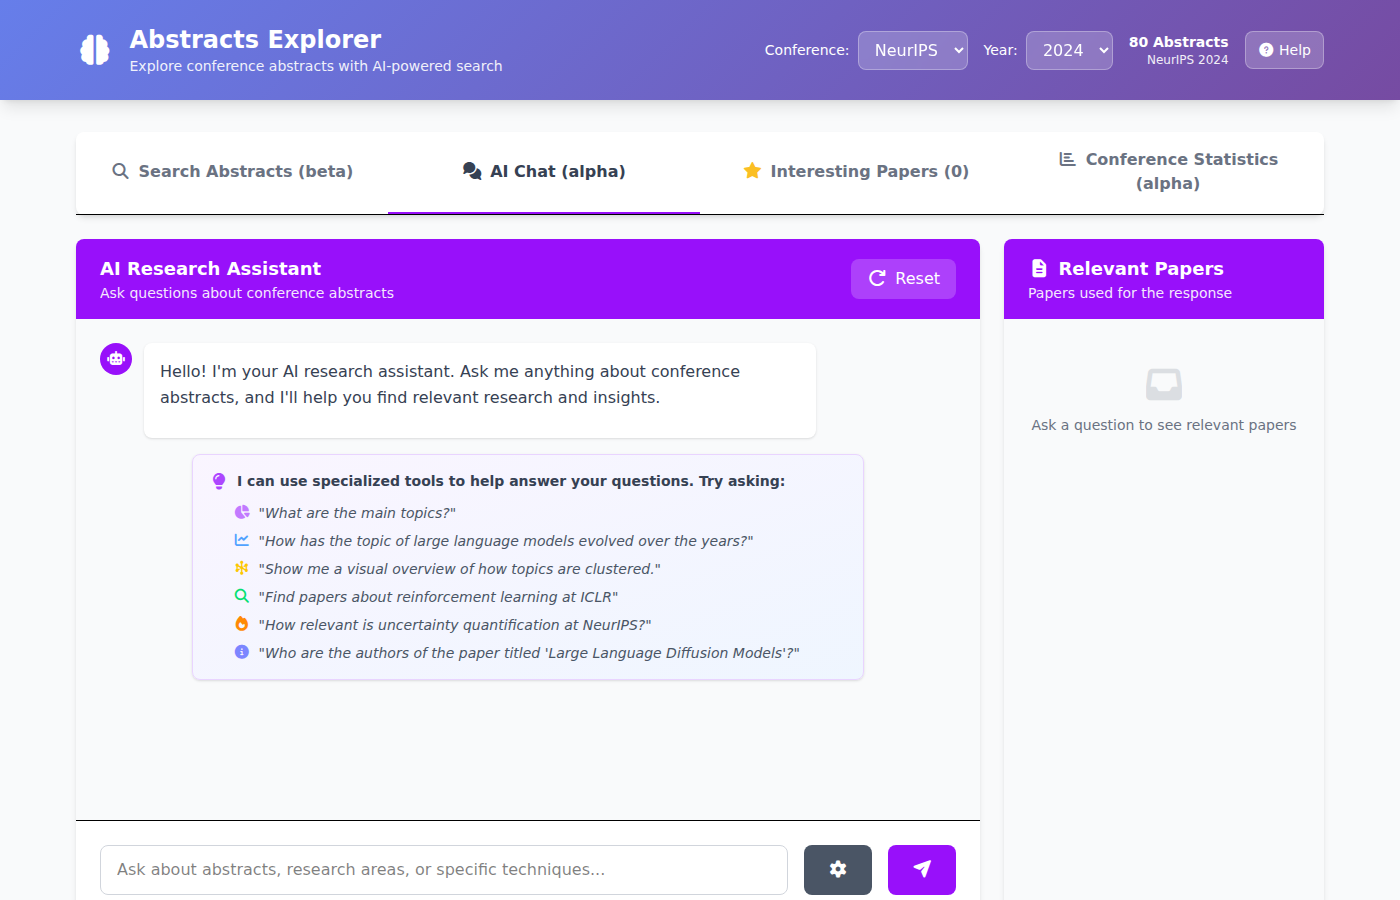
An AI assistant that answers questions about the loaded abstracts using Retrieval-Augmented Generation (RAG).
How to use it:
Type a question in the input box at the bottom and press Enter or click the send button.
The assistant retrieves relevant abstracts, uses them as context, and generates an answer.
The Relevant Papers panel on the right (or the View Papers button on mobile) shows which abstracts were used.
Ask follow-up questions — the assistant remembers the conversation.
Click Reset to start a fresh conversation.
Settings (gear icon): choose how many abstracts to include as context (3–50) and filter by session/track.
Specialized tools: The assistant can automatically call built-in analysis tools when you ask certain questions — you do not need to do anything special:
Tool |
What it does |
Example prompt |
|---|---|---|
|
Scores how prominent a topic is across conferences |
“How important is uncertainty quantification?” |
|
Tracks year-over-year changes in a topic |
“How has research on diffusion models evolved?” |
|
Finds the most relevant papers for a topic |
“Show me top papers on RLHF at NeurIPS” |
|
Returns full metadata for a specific paper |
“Who are the authors of ‘PICProp’?” |
|
Lists the main research clusters at a conference |
“What are the main topics at ICLR 2025?” |
|
Describes the 2-D cluster layout |
“Describe the cluster layout for NeurIPS 2024” |
See Chat Example for a full worked example conversation.
Interesting Papers
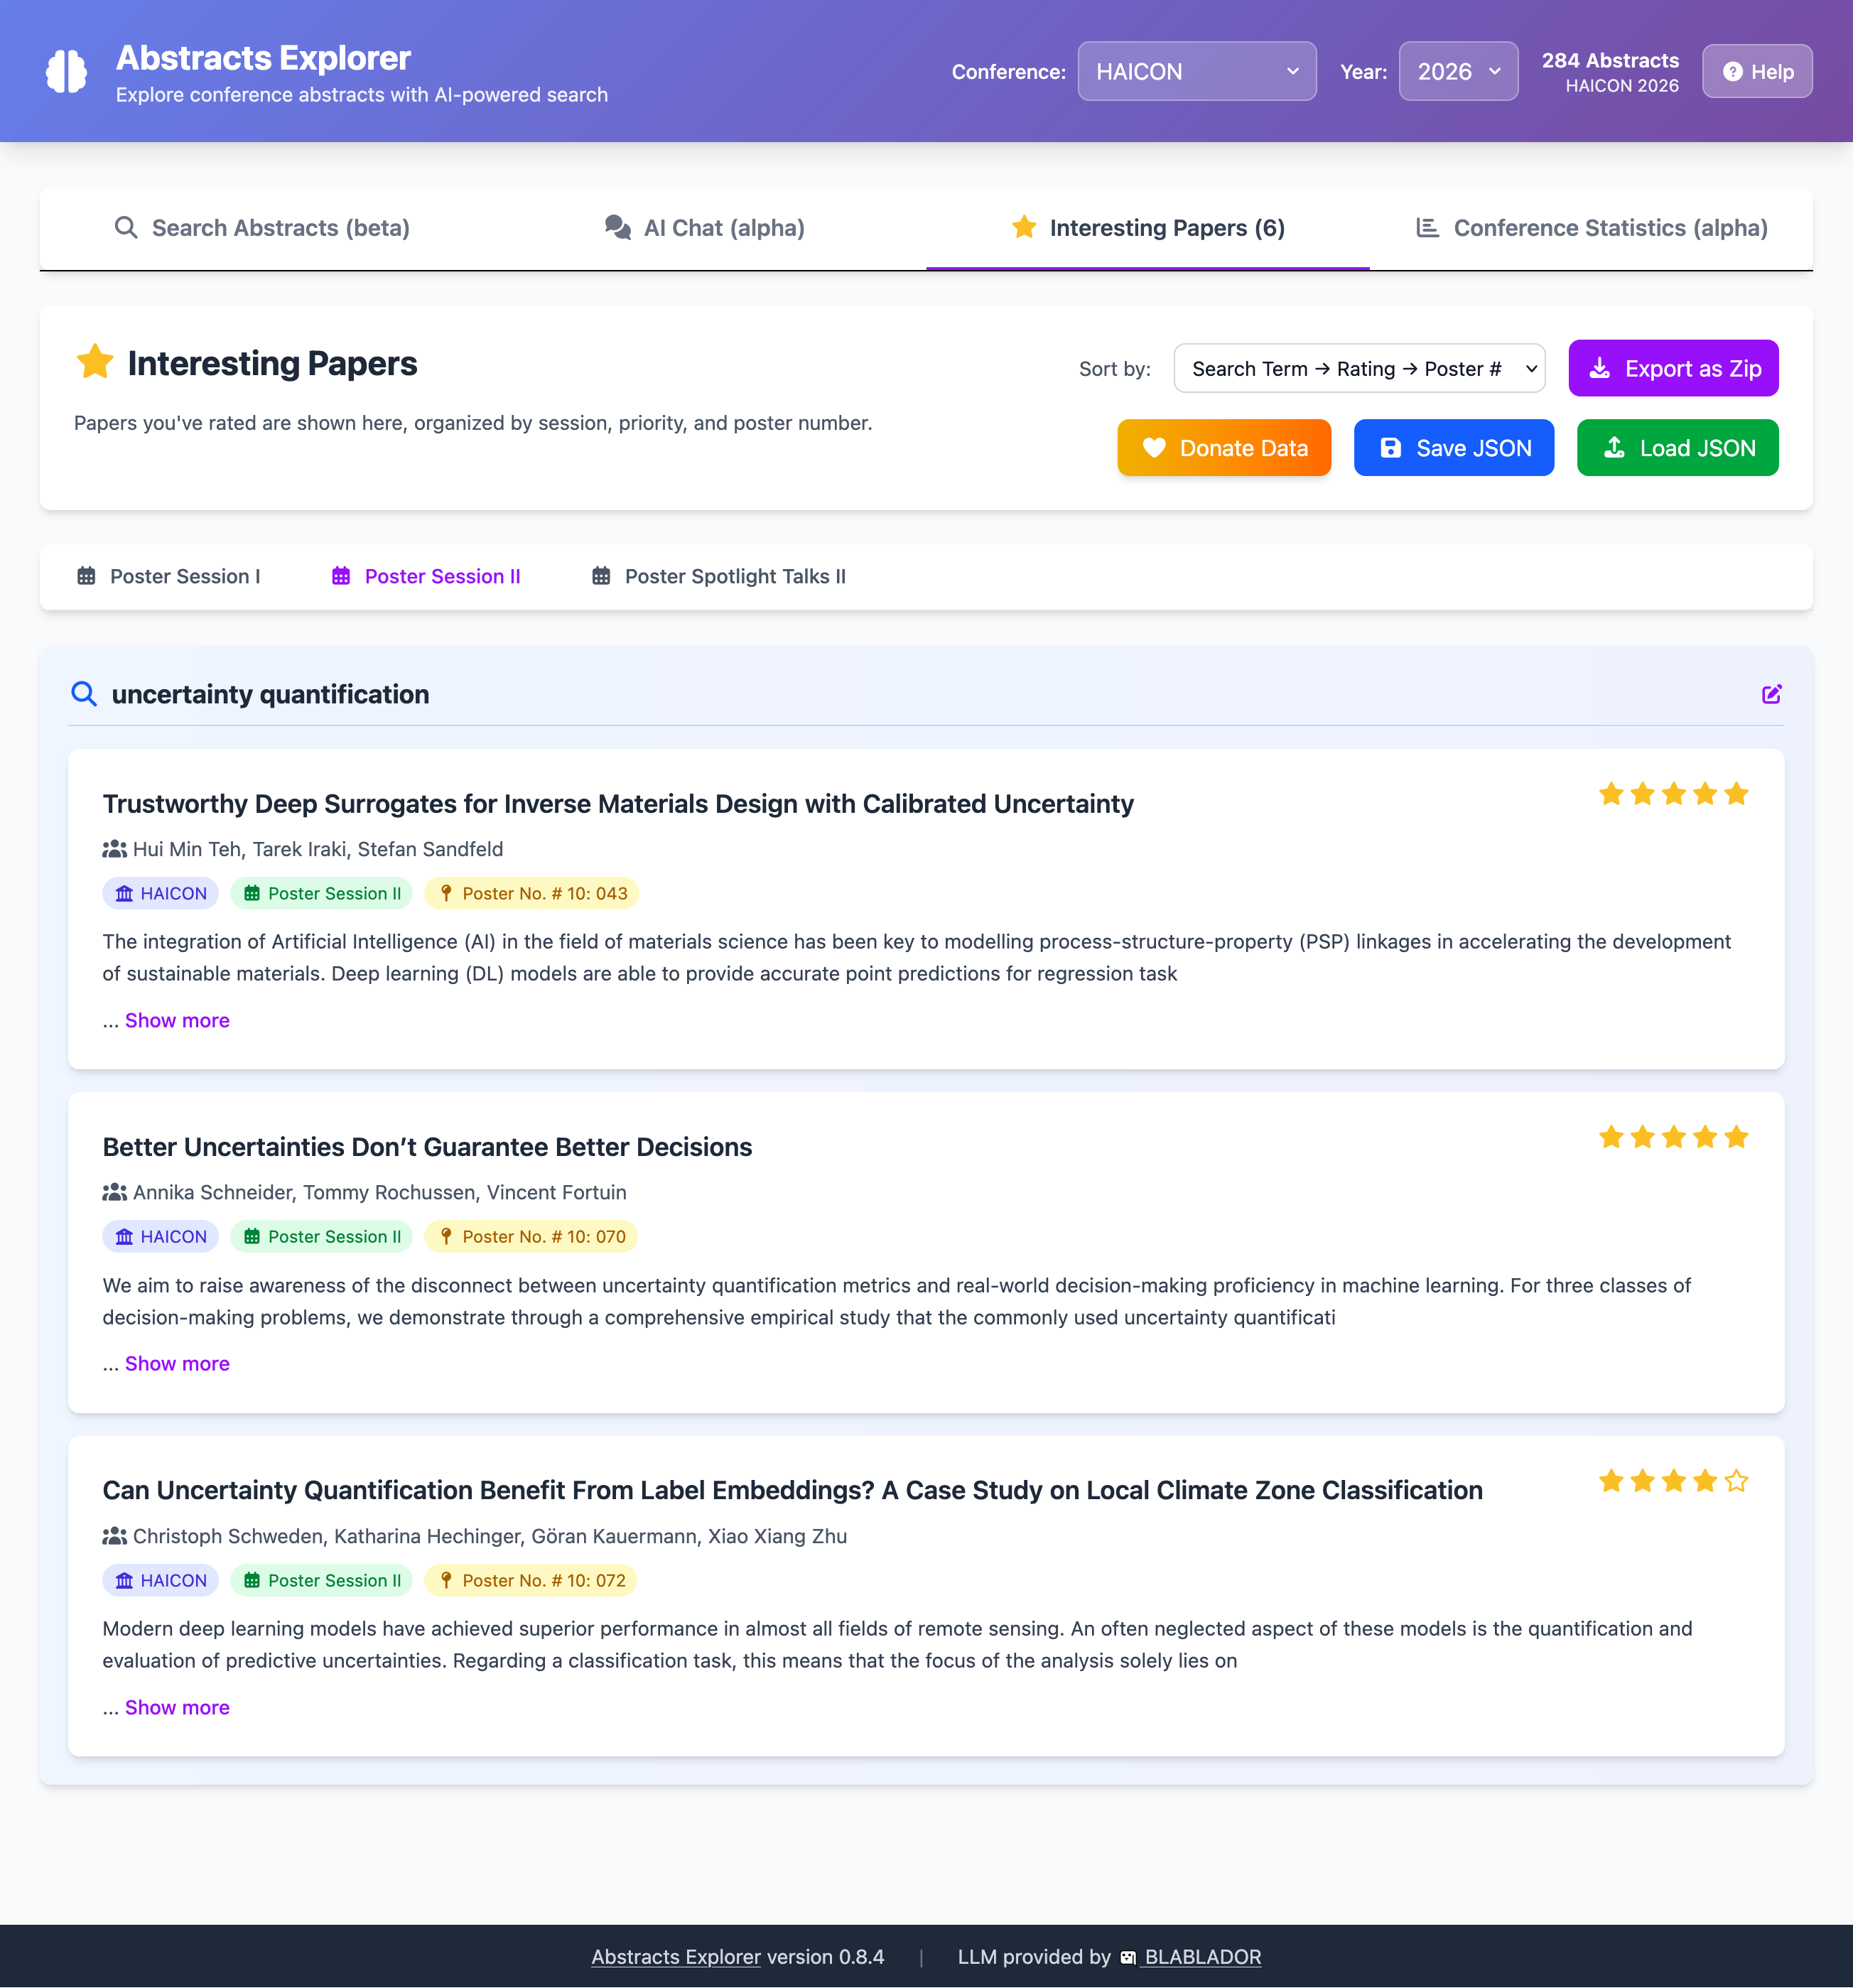
A personal reading list of papers you have starred.
How it works:
Rate a paper with stars (in the Search tab) and it appears here automatically.
Papers are grouped by session/track using sub-tabs.
Use the Sort by dropdown to reorder by search term, rating, or poster number.
Export and share:
Export as Zip — download a ZIP archive containing one Markdown file per paper with title, authors, abstract, and your notes.
Save JSON — save your full list (including ratings) as a JSON file.
Load JSON — import a previously saved JSON to restore your list on another device or browser.
Donate Data — optionally share your anonymized ratings to help improve the service.
Conference Statistics
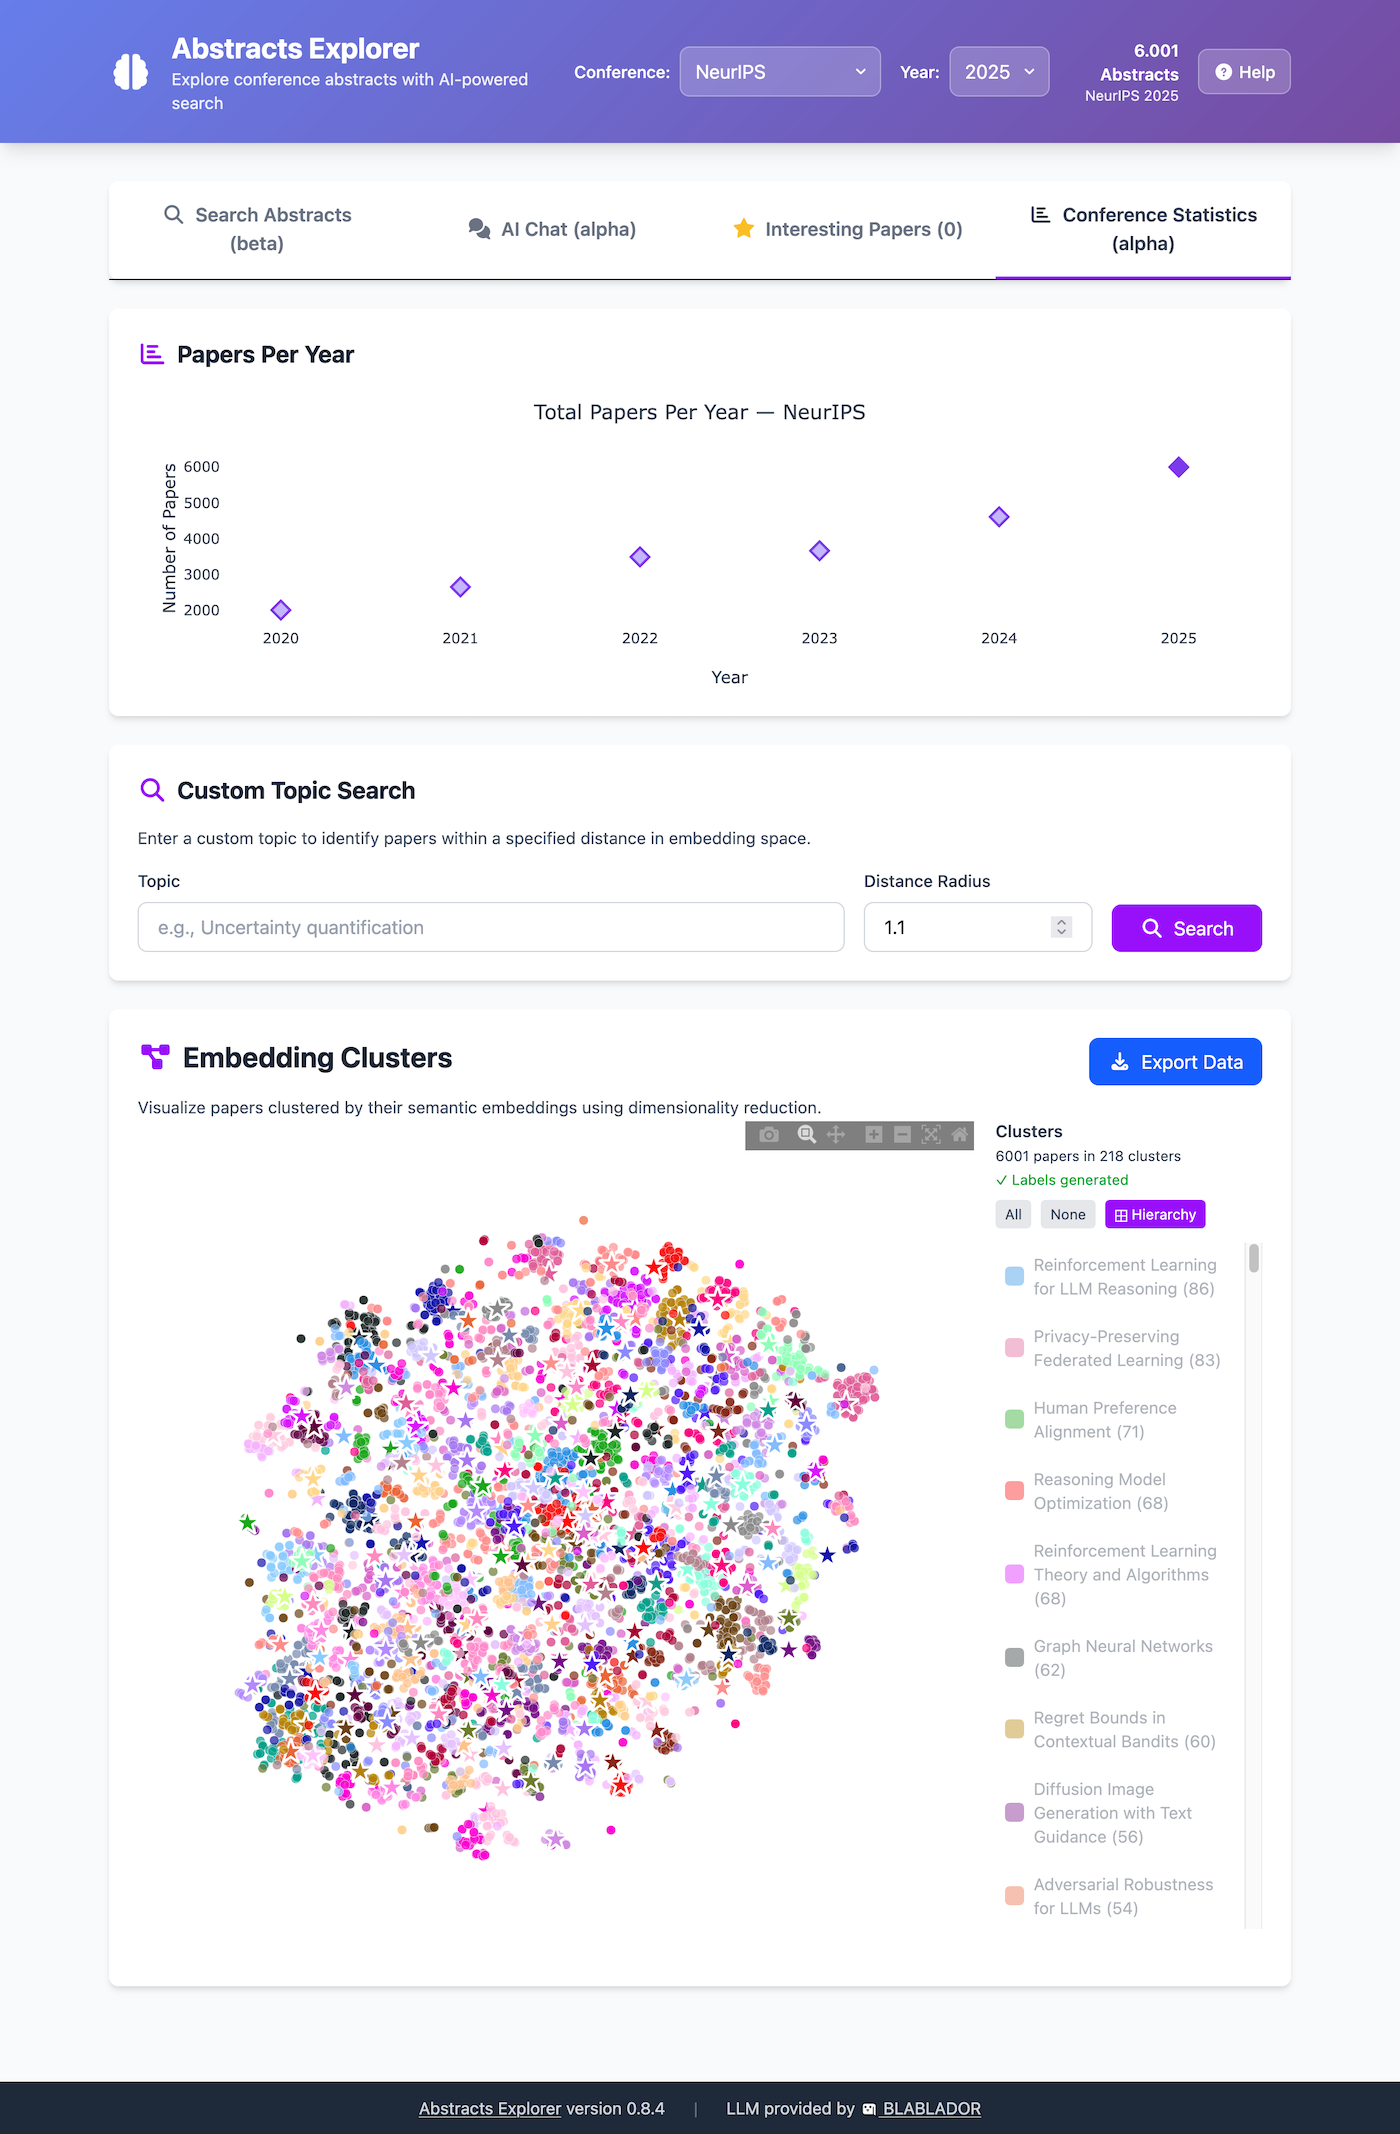
An overview of the loaded conference data and an interactive visualization of paper topics.
Papers Per Year
A bar chart showing how many papers are in the database for each year of the selected conference. Useful for a quick overview of the dataset.
Custom Topic Search
Enter any topic (e.g. "graph neural networks") and click Search to find
all papers within a specified embedding-space distance of that topic. The
results appear highlighted on the cluster plot and a Topic Evolution chart
shows how that topic’s paper count changed year over year.
Requires embeddings — this feature only works after running
abstracts-explorer create-embeddings.
Embedding Clusters
An interactive 2-D scatter plot where each dot is a paper, colored by automatically identified topic cluster.
Hover over a dot to see the paper title.
Click a dot to view full paper details below the plot.
Click a cluster name in the legend to highlight that cluster.
Export Data — download the raw clustering JSON for further analysis.
Requires pre-generated clusters — run
abstracts-explorer clustering pre-generatebefore using this view.
Starting the Web UI
Quick Start
1. Start the server:
abstracts-explorer web-ui
2. Open your browser at http://127.0.0.1:5000.
Command-line options
abstracts-explorer web-ui [OPTIONS]
Option |
Description |
|---|---|
|
Bind address (default: |
|
Port number (default: |
|
Use Flask development server instead of Waitress |
|
Increase log verbosity |
Docker / Podman
See the Docker Guide for running the docker container.